Category Archives: Things that happen

SQL Plan Baselines – the parallel trap

Today, the good news is that I have time to write this blog post. The less good news is that our basement got flooded and I have to stay home. The bad news is, my current client does not allow remote work 🙁
So, blog post it is…

There are a number of reasons why a SQL Plan Baseline might not get used. Here’s one I was not fully aware of until recently (although it makes perfect sense when you think about it): ALTER SESSION FORCE PARALLEL QUERY [PARALLEL n].
In the simplest of cases the outcome whether a SQL Plan Baseline is used depends on the following:

  • PARALLEL_DEGREE_POLICY parameter
  • table decoration (DEGREE)
  • optimizer enviroment used to generate the plan baseline (ENABLE PARALLEL / FORCE PARALLEL / FORCE PARALLEL n)
  • optimizer environment of the session executing the query (ENABLE PARALLEL / FORCE PARALLEL / FORCE PARALLEL n)
  • plan in the baseline (serial or parallel plan?)

The base of the test case is a simple table that I’m going to select:

create table t1
as
select rownum id, 'ABC' text
from dual connect by level <= 100
;

For every combination of interest we run through the following procedure:
1) open and configure a new session for the parse environment on which the plan baseline is based
2) run this query “select * from t1”
3) create a fixed plan baseline for the generated plan
4) re-connect and configure the parse environment for the executing session
5) run query from step 2) and collect cursor information
do steps 4) and 5) for ENABLE PARALLEL, FORCE PARALLEL, and FORCE PARALLEL n

Test 1: object DEGREE 1, parallel_degree_policy = manual

parsing session (SPB)
/
executing session
enable (serial plan) force (parallel plan) force 4 (parallel plan)
enable (default) used not used (*3) not used (*3)
force not used (*1) used used
force 4 not used (*2) used used

*1) Degree of Parallelism is 8 because of table property
*2) Degree of Parallelism is 4 because of session
*3) No note in the plan about DOP or baseline
Summary for test 1:
If you have a serial plan in the baseline and use any force parallel on the session the plan baseline is not used and you get a parallel plan.
If you have a parallel plan in the baseline and run the query on a session with ENABLE PARALLEL QUERY (default settings) the plan baseline is not used and you get a serial plan.

Test 2: object DEGREE 1, parallel_degree_policy = limited

parsing session (SPB)
/
executing session
enable (serial plan) force (parallel plan) force 4 (parallel plan)
enable (default) used used used (*3)
force not used (*1) used used (*3)
force 4 not used (*2) used used

*1) automatic DOP: Computed Degree of Parallelism is 2
*2) Degree of Parallelism is 4 because of session
*3) Degree of Parallelism is 2 because of hint
Summary for test 2:
If you have a serial plan in the baseline and use any force parallel on the session the plan baseline is not used and you get a parallel plan.
Now that we allow for auto DOP the session with ENABLE PARALLEL QUERY can use parallel plans in plan baselines.

Test 3: object DEGREE DEFAULT, parallel_degree_policy = limited

parsing session (SPB)
/
executing session
enable (serial plan (*4)) force (parallel plan) force 4 (parallel plan)
enable (default) used used used (*3)
force not used (*1) used used (*3)
force 4 not used (*2) used used

*1) automatic DOP: Computed Degree of Parallelism is 2
*2) Degree of Parallelism is 4 because of session
*3) Interestingly, there is no note about DOP in the plan at all. But it uses the plan baseline.
*4) automatic DOP: Computed Degree of Parallelism is 1 because of parallel threshold
Summary for test 3:
If you have a serial plan in the baseline and use any force parallel on the session the plan baseline is not used and you get a parallel plan.
Again, as we allow for auto DOP the session with ENABLE PARALLEL QUERY can use parallel plans in plan baselines. The result is the same as Test 2 but some the notes in the plans differ.

Test 4: object DEGREE DEFAULT, parallel_degree_policy = limited, fake stats so DOP > 1 for all plan baselines

parsing session (SPB)
/
executing session
enable (parallel plan (*1)) force (parallel plan) force 4 (parallel plan)
enable (default) used used used
force used used used
force 4 used used used

*1) automatic DOP: Computed Degree of Parallelism is 2
Summary for test 4:
Naturally, now that we always have parallel plans in the plan baselines and the object statistics call for auto DOP > 1 the plan baselines get used in all cases.

Why did I do this? See, there’s this batch job with a SQL that has a SQL Plan Baseline on it (serial plan). Now, every once in a while the run-time of this batch job goes through the roof and every time this happens I see that the query does not use the baseline (v$sql.sql_plan_baseline is NULL). Also, next to different PLAN_HASH_VALUEs I noticed different OPTIMIZER_ENV_HASH_VALUEs. Checking the session settings V$SES_OPTIMIZER_ENV showed that “parallel_query_forced_dop” was set to “default”, which means “ALTER SESSION FORCE PARALLEL QUERY” was run previously on that session.
But why is it not deterministic? The tool that runs all the batch jobs uses a connection pool, some job steps force parallel and some don’t. We haven’t been able to technically confirm this but everything points towards that this session property is not cleared to default when a connection gets reused. So, sometimes this batch job just gets unlucky by the session it gets from the connection pool.
The solution: Adding second SQL Plan Baseline. This plan is a parallel plan with the same structure as the original serial plan. Now, either one of the plan baselines (serial or parallel plan) is being used depending on the session configuration.

Footnote:
When you use “FORCE PARALLEL QUERY” you might get a serial plan. You’ll see this in the plan notes: “automatic DOP: Computed Degree of Parallelism is 1”. Obviously, this would change some of above results.
View merging limitation on OUTER JOIN

This is a short note about a limitation in complex view merging for outer joins.

We start with two simple tables, t1 and t2. To show the effect we don’t even need to load any data.

create table t1 (
    id1 number not null
  , vc1 varchar2(200)
);

create table t2 (
    id1 number not null
  , id2 number not null
  , num1 number
);

I know, I said it’s about outer joins but let’s first check the execution plan for the INNER JOIN.

explain plan for
select *
from t1
  inner join (
    select /*+ merge */
        id2
      , 0 x
      , sum(num1) sum_num1
    from t2
    group by id2
  ) s1 on (s1.id2 = t1.id1)
;

select * from dbms_xplan.display();

----------------------------------------------------------------------------
| Id  | Operation           | Name | Rows  | Bytes | Cost (%CPU)| Time     |
----------------------------------------------------------------------------
|   0 | SELECT STATEMENT    |      |     1 |   153 |     5  (20)| 00:00:01 |
|   1 |  HASH GROUP BY      |      |     1 |   153 |     5  (20)| 00:00:01 |
|*  2 |   HASH JOIN         |      |     1 |   153 |     4   (0)| 00:00:01 |
|   3 |    TABLE ACCESS FULL| T1   |     1 |   127 |     2   (0)| 00:00:01 |
|   4 |    TABLE ACCESS FULL| T2   |     1 |    26 |     2   (0)| 00:00:01 |
----------------------------------------------------------------------------

Oracle merges the inline view as instructed by the MERGE hint. Btw., I’m only using the hint for demonstration purposes.

What happens if we change the join to a LEFT OUTER JOIN?

explain plan for
select *
from t1
  left outer join (
    select /*+ merge */
        id2
      , 0 x
      , sum(num1) sum_num1
    from t2
    group by id2
  ) s1 on (s1.id2 = t1.id1)
;
select * from dbms_xplan.display();

-----------------------------------------------------------------------------
| Id  | Operation            | Name | Rows  | Bytes | Cost (%CPU)| Time     |
-----------------------------------------------------------------------------
|   0 | SELECT STATEMENT     |      |     1 |   143 |     5  (20)| 00:00:01 |
|*  1 |  HASH JOIN OUTER     |      |     1 |   143 |     5  (20)| 00:00:01 |
|   2 |   TABLE ACCESS FULL  | T1   |     1 |   115 |     2   (0)| 00:00:01 |
|   3 |   VIEW               |      |     1 |    28 |     3  (34)| 00:00:01 |
|   4 |    HASH GROUP BY     |      |     1 |    26 |     3  (34)| 00:00:01 |
|   5 |     TABLE ACCESS FULL| T2   |     1 |    26 |     2   (0)| 00:00:01 |
-----------------------------------------------------------------------------

The inline view is not merged anymore. The optimizer trace reveals why it cannot merge the view anymore:

CVM:   Checking validity of merging in query block SEL$2 (#2)
CVM:     CVM bypassed: View on right side of outer join contains view with illegal column.
CVM:     CVM bypassed: Externally referenced expressions are not merge-safe.
CVM:     CVM bypassed: view on right side of Outer Join + MuLTiple TABle.

In case you haven’t noticed, there’s this little expression in the projection of the inner SELECT on line 7 (“0 x”). As soon as we remove it, the view will be merged by the optimizer also for LEFT OUTER JOIN.

explain plan for
select *
from t1
  left outer join (
    select /*+ merge */
        id2
--    , 0 x
      , sum(num1) sum_num1
    from t2
    group by id2
  ) s1 on (s1.id2 = t1.id1)
;
select * from dbms_xplan.display();

----------------------------------------------------------------------------
| Id  | Operation           | Name | Rows  | Bytes | Cost (%CPU)| Time     |
----------------------------------------------------------------------------
|   0 | SELECT STATEMENT    |      |     1 |   153 |     5  (20)| 00:00:01 |
|   1 |  HASH GROUP BY      |      |     1 |   153 |     5  (20)| 00:00:01 |
|*  2 |   HASH JOIN OUTER   |      |     1 |   153 |     4   (0)| 00:00:01 |
|   3 |    TABLE ACCESS FULL| T1   |     1 |   127 |     2   (0)| 00:00:01 |
|   4 |    TABLE ACCESS FULL| T2   |     1 |    26 |     2   (0)| 00:00:01 |
----------------------------------------------------------------------------

Thanks to point and click tools *cough* Cognos *cough* I’ve seen this a lot lately 😉

Footnote: tests run on 12.2.0.1

Assumption is the mother of all funny things

While analyzing a performance issue with a 63-table join query (you gotta love Siebel) I came accross a little optimizer oddity. Looking at a 600MB optimizer trace was fun, though 😉

The problem boiled down to this:

------------------------------------------------------------------------------------------
| Id  | Operation                    | Name      | Rows  | Bytes | Cost (%CPU)| Time     |
------------------------------------------------------------------------------------------
|   0 | SELECT STATEMENT             |           |    83 |  6225 |    10   (0)| 00:00:01 |
|   1 |  NESTED LOOPS OUTER          |           |    83 |  6225 |    10   (0)| 00:00:01 |
|*  2 |   TABLE ACCESS STORAGE FULL  | T1        |     2 |    20 |     9   (0)| 00:00:01 |
|   3 |   TABLE ACCESS BY INDEX ROWID| T2        |    41 |  2665 |     1   (0)| 00:00:01 |
|*  4 |    INDEX UNIQUE SCAN         | T2_IDX_01 |     1 |       |     0   (0)| 00:00:01 |
------------------------------------------------------------------------------------------

Would you expect the cardinality estimate for table access on T2 (plan Id 3) to be 41?
I certainly wouldn’t. It’s doing an INDEX UNIQUE SCAN on index T2_IDX_01 (plan Id 4) and according to the cardinality estimate on T2 (plan Id 2) it will do that INDEX UNIQUE SCAN two times.
Why does the optimizer think it will get 41 rows per given ID value in the index while obviously a UNIQUE INDEX SCAN can only return 0 or 1 ROWID?

From the large Siebel query I managed to deduce a simple test case:

create table t1 (
    id number(10) not null
  , id2 number(10) not null
  , id3 number(10)
  , constraint t1_pk primary key (id)
      using index (create unique index t1_idx_01 on t1 (id))
);

create table t2 (
    id number(10)
  , text varchar2(100)
  , constraint t2_pk primary key (id)
      using index (create unique index t2_idx_01 on t2 (id))
);

Only table T1 is populated with data. Column ID3 will be 50% NULL values, the other 50% will be “1”.

insert into t1 (id, id2, id3)
select
    rownum id
  , rownum id2
  , decode(mod(rownum, 2), 0, null, 1) id3
from dual connect by level <= 10000
;
commit;

-- gather stats on T1 and related indexes without histograms
exec dbms_stats.gather_table_stats(user, 'T1', cascade => true, method_opt => 'FOR ALL COLUMNS SIZE 1')

And that’s the query which produced above execution plan:

select *
from t1
   , t2
where t1.id2 in (10, 20)
and t1.id3 = t2.id(+)
;

Perhaps you noticed that I didn’t gather statistics for table T2, which was exactly the sitution I had in the Siebel database. Several tables involved in the 63-table join did not have statistics on them.
In case you’re wondering, according to Oracle’s Siebel “best practice” you’re not supposed to have statistics on tables with less than 15 rows in them (see Oracle’s script coe_siebel_stats.sql v11.4.4.6).

Now, back to the orginal question: How does Oracle come up with 41?
First, for any table that does not have statistics Oracle seems to assume a cardinality of 82. I don’t know where that magic number comes from. Maybe it simply takes 1% of 8192, the default database block size.
The extract from optimizer trace shows table T2 is not analyzed and contains 82 rows:

BASE STATISTICAL INFORMATION
***********************
Table Stats::
  Table: T2  Alias: T2  (NOT ANALYZED)
  #Rows: 82  SSZ: 0  LGR: 0  #Blks:  1  AvgRowLen:  100.00  NEB: 0  ChainCnt:  0.00  SPC: 0  RFL: 0  RNF: 0  CBK: 0  CHR: 0  KQDFLG: 0
  #IMCUs: 0  IMCRowCnt: 0  IMCJournalRowCnt: 0  #IMCBlocks: 0  IMCQuotient: 0.000000
  Column (#1): ID(NUMBER)  NO STATISTICS (using defaults)
    AvgLen: 13 NDV: 3 Nulls: 0 Density: 0.390244

...
SINGLE TABLE ACCESS PATH 
...
  Table: T2  Alias: T2
    Card: Original: 82.000000  Rounded: 82  Computed: 82.000000  Non Adjusted: 82.000000

Also, the optimizer guesses the NDV(3) and number of nulls(0) for the ID column of table T2.

… if you think it simply divides 82 by 2, read on 🙂 …

Secondly, after studying different data patterns I think this is what happens.
Because of above outlined assumptions the adjusted selectivty for T2 will always be 1 in the join selectivity calculation.
And, since we have a low NDV on T1.ID3 we end up with a gross misestimate for the join selectivity.

join-sel =
  ((num_rows(t1) - num_nulls(t1.id3) / num_rows(t1)) *
  ((num_rows(t2) - num_nulls(t2.id) / num_rows(t2)) /
  greater(num_distinct(t1.id3), num_distinct(t2.id))

join-sel =
  ((10000 - 5000 / 10000) *
  ((82 - 0 / 82) /
  greater(1, 3)
  = 0.16666666666666666666666666666667

From the optimzer trace we see that the join selectivity of 0.500000 does not exactly match our calculation. Interestingly, the optimizer seems to ignore the guessed NDV of 3 for T2.ID and instead use the NDV from T1.ID3, which would give you 0.5.

Outer Join Card:  83.000000 = max ( outer (2.000000),(outer (2.000000) * inner (82.000000) * sel (0.500000)))

So here it is, we’ve got our number 41: (82.000000) * sel (0.500000)

Note, the table access cardinality (plan Id 3) is based on the join selectivity which doesn’t account for the in-list predicate on T1, as one would expect. The in-list is accounted for in the filtered table cardinality of table T1 and so is reflected in the join cardinality (plan Id 1).

Lastly, the cardinality estimate for plan Id 3 (TABLE ACCESS BY INDEX ROWID) is independently calculated from plan Id 4 (INDEX UNIQUE SCAN). I think there should be a sanity check to adjust the estimate for the table access to T2 (plan Id 3) when the row source is fed by an INDEX UNIQUE SCAN.

Here’s another example:

insert into t1 (id, id2, id3)
select
    rownum id
  , rownum id2
  , decode(mod(rownum, 4), 0, null, dbms_random.value(1, 6)) id3
from dual connect by level <= 10000
;
commit;

-- gather stats on T1 without histograms
exec dbms_stats.gather_table_stats(user, 'T1', cascade => true, method_opt => 'FOR ALL COLUMNS SIZE 1')

This time, column ID3 contains 25% NULL values, the other 75% are evenly distributed between “1” and “6”.

SQL> select column_name, histogram, num_distinct, density, num_nulls from dba_tab_columns where table_name = 'T1' order by column_name;

COLUMN_NAME                    HISTOGRAM       NUM_DISTINCT    DENSITY  NUM_NULLS
------------------------------ --------------- ------------ ---------- ----------
ID                             NONE                   10000      .0001          0
ID2                            NONE                   10000      .0001          0
ID3                            NONE                       6 .166666667       2500

So, according to above formulae & data it would go like this:

join-sel =
  ((10000 - 25000 / 10000) *
  ((82 - 0 / 82) /
  greater(6, 3)
  = 0.125

card = round(82 * 0.125) = 10

Again, the optimizer trace confirms the calculation, this time it’s spon-on because it again uses the NDV from T1.ID3 (which is greater than 3 anyway):

Outer Join Card:  21.000000 = max ( outer (2.000000),(outer (2.000000) * inner (82.000000) * sel (0.125000)))
------------------------------------------------------------------------------------------
| Id  | Operation                    | Name      | Rows  | Bytes | Cost (%CPU)| Time     |
------------------------------------------------------------------------------------------
|   0 | SELECT STATEMENT             |           |    21 |  1596 |    10   (0)| 00:00:01 |
|   1 |  NESTED LOOPS OUTER          |           |    21 |  1596 |    10   (0)| 00:00:01 |
|*  2 |   TABLE ACCESS STORAGE FULL  | T1        |     2 |    22 |     9   (0)| 00:00:01 |
|   3 |   TABLE ACCESS BY INDEX ROWID| T2        |    10 |   650 |     1   (0)| 00:00:01 |
|*  4 |    INDEX UNIQUE SCAN         | T2_IDX_01 |     1 |       |     0   (0)| 00:00:01 |
------------------------------------------------------------------------------------------

The case for the Siebel query was little more complex but ulitmately it was the magic number 82 that caused the optimizer to choose a inefficient join order.

Tracking down PGA memory leak – a walkthrough

The other day I tracked down a nasty problem one application was having. It was first noticed in the alert.log:

ORA-04036: PGA memory used by the instance exceeds PGA_AGGREGATE_LIMIT
...
PGA memory used by the instance exceeds PGA_AGGREGATE_LIMIT of 7000 MB
Immediate Kill Session#: 686, Serial#: 26646
Immediate Kill Session: sess: 0x19e7c2a78  OS pid: 35173

Checking the PGA memory from gv$process revealed a shocking picture:

SQL> select prc.inst_id, ses.sid, ses.serial#, prc.pid, prc.spid, round(prc.pga_used_mem/1024/1024) used_mb, round(prc.pga_alloc_mem/1024/1024) alloc_mb, round((prc.pga_alloc_mem - prc.pga_used_mem)/1024/1024, 0) unused_mb, round(prc.pga_freeable_mem/1024/1024) freeable_mb, round(prc.pga_max_mem/1024/1024) max_mb
from gv$process prc
  left outer join gv$session ses on (ses.inst_id = prc.inst_id and ses.paddr = prc.addr and ses.type = 'USER')
order by used_mb desc
fetch first 10 rows only;

   INST_ID        SID    SERIAL#        PID SPID                        USED_MB   ALLOC_MB  UNUSED_MB                             FREEABLE_MB     MAX_MB
---------- ---------- ---------- ---------- ------------------------ ---------- ---------- ---------- --------------------------------------- ----------
         1        655      50496         89 338934                          227        284         57                                       0        499
         1        675      45630        137 338938                          223        280         57                                       0        296
         1        416       7124        285 315339                          222        281         58                                       1        298
         1        290      45321        296 81710                           184        233         49                                       0        280
         2        296      52565         98 223329                          163        207         45                                       0        270
         2        710       8463        293 386687                          162        207         45                                       0        270
         1         67      15923         54 98311                           147        187         40                                       0        264
         2        295      25163        242 316189                          143        185         42                                       0        266
         1         32      55120        270 358206                          137        178         41                                       0        260
         2        309      13006        230 167307                          135        175         39                                       0        258

 10 rows selected 

A lot of sessions used between 100MB and 230MB. Monitoring these sessions over some time showed that the memory was never released, something’s definitely wrong. PGA dumps of a couple of connections all showed the same pattern.

oradebug setmypid
oradebug dump pga_detail_get <pid>
SQL> select category, name, heap_name, round(bytes/1024/1024, 0) size_mb, allocation_count
from gv$process_memory_detail
where pid = 89
order by pid, bytes desc
fetch first 10 rows only;

CATEGORY        NAME                       HEAP_NAME          SIZE_MB                        ALLOCATION_COUNT
--------------- -------------------------- --------------- ---------- ---------------------------------------
Other           permanent memory           kolarsCreateCt         214                                   10541
Other           free memory                top uga heap            57                                    1571
Other           free memory                kolarsCreateCt           3                                    4907
Other           free memory                session heap             2                                    1016
Other           kollalos2                  koh-kghu sessi           1                                      86
Other           permanent memory           pga heap                 1                                      43
Other           kxsFrame4kPage             session heap             0                                     123
Other           qmushtCreate               qmtmInit                 0                                       6
PL/SQL          static frame of inst       koh-kghu sessi           0                                      36
Other           inode->map_kdlimem         buckets_kdliug           0                                       9

The closest I come to kolarsCreateCt in the oradebug doc is this:

oradebug doc component
...
Components in library GENERIC:
--------------------------
...
  LOB                          LOB (koll, kola)
...

This is the clue that there is apparently a LOB resource management problem. Luckily, the PL/SQL code base was not too big and only a couple of places where LOB handling was done. But, all LOBs seemed to be handled correctly.
One thing, though, I first didn’t pay much attention to was a few “XMLTYPE.getClobVal()” in SELECT statements. I’ve used that myself in the past a couple of times and knew this returned a persistent LOB handle and should not leak.
I took one of these SQL statements and ran them in my favorite tool, SQL Developer, and BOOOOOM! My session just consumed a couple of hundreds of megabytes of PGA memory and wouldn’t release it until I closed the connection.

So I crafted a little test case to check what’s going on.

SQL> create table xmltest(id number, data xmltype, primary key (id))
SQL>   xmltype column data store as binary xml;
SQL> insert into xmltest (id, data) values (1, '<someelement></someelement>');
SQL> commit;
SQL> select t.id, dbms_lob.istemporary(t.data.getclobval()) is_temp from xmltest t;

        ID    IS_TEMP
---------- ----------
         1          1

I don’t think this is what I knew from past experience so I did a quick MOS search and found following bug report:
Bug 23061709 : HIGH KOLARSCREATECT AND ORA-04036 WHEN XMLTYPE COLUMN IS STORED AS BINARY

OK, lets change the XMLType storage to CLOB and see what happens:

SQL> create table xmltest(id number, data xmltype, primary key (id))
SQL>   xmltype column data store as securefile clob;
SQL> insert into xmltest (id, data) values (1, '<someelement></someelement>');
SQL> commit;
SQL> select t.id, dbms_lob.istemporary(t.data.getclobval()) is_temp from xmltest t;

        ID    IS_TEMP
---------- ----------
         1          0

To be fair, the documentation for 11.2, 12.1, and 12.2 all state the following:
“This member function returns a CLOB containing the serialized XML representation. If the CLOB returned is temporary, it must be freed after use.”

Because I always run my tests in SQL*Plus additionally to SQL Developer I was puzzled to see that there’s no memory leak. Why does it not happen in SQL*Plus? I thought that maybe SQL*Plus is clever enough to always check for temporary LOBs and free them.

Firing up gdb with this script proved me right.

break OCILobFreeTemporary
  commands
    where
    continue
  end

This SQL fetches five rows with CLOB data.

SQL> select t.id, t.data.getclobval() from xmltest t where rownum <= 5;

Output from gdb:

Breakpoint 1, 0x00007f678cc3d250 in OCILobFreeTemporary () from /u01/app/oracle/product/12.1.0.2.161018/RAC/lib/libclntsh.so.12.1
#0  0x00007f678cc3d250 in OCILobFreeTemporary () from /u01/app/oracle/product/12.1.0.2.161018/RAC/lib/libclntsh.so.12.1
#1  0x00007f678eafb1ef in afioci () from /u01/app/oracle/product/12.1.0.2.161018/RAC/lib/libsqlplus.so
#2  0x00007f678eaed912 in afifpilobfreetemp () from /u01/app/oracle/product/12.1.0.2.161018/RAC/lib/libsqlplus.so
#3  0x00007f678eaed799 in afifpifretmp () from /u01/app/oracle/product/12.1.0.2.161018/RAC/lib/libsqlplus.so
#4  0x00007f678eae8f20 in afidet () from /u01/app/oracle/product/12.1.0.2.161018/RAC/lib/libsqlplus.so
#5  0x00007f678eb272f3 in safiqry () from /u01/app/oracle/product/12.1.0.2.161018/RAC/lib/libsqlplus.so
#6  0x00007f678eb096e3 in afiqry () from /u01/app/oracle/product/12.1.0.2.161018/RAC/lib/libsqlplus.so
#7  0x00007f678eb21bf2 in afixeqqry () from /u01/app/oracle/product/12.1.0.2.161018/RAC/lib/libsqlplus.so
#8  0x00007f678eb21521 in afixeqsql () from /u01/app/oracle/product/12.1.0.2.161018/RAC/lib/libsqlplus.so
#9  0x00007f678eb20ed5 in afixeqr () from /u01/app/oracle/product/12.1.0.2.161018/RAC/lib/libsqlplus.so
#10 0x00007f678eabfd74 in aficfd () from /u01/app/oracle/product/12.1.0.2.161018/RAC/lib/libsqlplus.so
#11 0x00007f678eabec49 in aficdr () from /u01/app/oracle/product/12.1.0.2.161018/RAC/lib/libsqlplus.so
#12 0x00007f678eaeacf2 in afidrv () from /u01/app/oracle/product/12.1.0.2.161018/RAC/lib/libsqlplus.so
#13 0x00000000004007a1 in main ()

Breakpoint 1, 0x00007f678cc3d250 in OCILobFreeTemporary () from /u01/app/oracle/product/12.1.0.2.161018/RAC/lib/libclntsh.so.12.1
...
#13 0x00000000004007a1 in main ()

Breakpoint 1, 0x00007f678cc3d250 in OCILobFreeTemporary () from /u01/app/oracle/product/12.1.0.2.161018/RAC/lib/libclntsh.so.12.1
...
#13 0x00000000004007a1 in main ()

Breakpoint 1, 0x00007f678cc3d250 in OCILobFreeTemporary () from /u01/app/oracle/product/12.1.0.2.161018/RAC/lib/libclntsh.so.12.1
...
#13 0x00000000004007a1 in main ()

Breakpoint 1, 0x00007f678cc3d250 in OCILobFreeTemporary () from /u01/app/oracle/product/12.1.0.2.161018/RAC/lib/libclntsh.so.12.1
...
#13 0x00000000004007a1 in main ()

Five rows fetched and gdb shows five calls to OCILobFreeTemporary. The call to OCILobFreeTemporary originates from libsqlplus.so which tells me it’s not the OCI layer itself handling it, it’s the logic in SQL*Plus.

Next, I wanted to see myself what happens in a Java/JDBC application. Here’s the relevant snippet from my test case:

      String sql = "select t.id, t.data.getclobval() from xmltest t where rownum <= 5";
      stmt = conn.prepareStatement(sql);
      
      for (int i=0; i<3; i++) {
      stmt = conn.prepareStatement(sql);
        rset = stmt.executeQuery();

        while (rset.next ()) {
          System.out.println (rset.getInt(1));
          xmlclob = rset.getClob(2);
          xmlclob.free();
        }

        rset.close();

        c.format("\nPress ENTER 1 to proceed.\n");
        c.readLine();
      }

Like SQL*Plus being an application handling the LOB resources, you have to do it programmatically in Java as well. Line 11 frees the temporary LOB.
Without the free() call on the Clob you will see the memory leak when there XMLType storage clause is XML BINARY. It happens, even when do don’t reference the LOB column in Java:

        while (rset.next ()) {
          System.out.println (rset.getInt(1));
        }

Lesson learnt: never trust what you think you know! Sometimes things change in subtle ways.

GUID, or how to Get Ur Index from Disk

Who doesn’t want to write scalable applications these days? Then maybe you should think twice about using GUIDs as primary keys. It’s mostly not about storage overhead, or the fact that surrogate keys are not always the best solution. It is about performance!

I’m going to talk about Oracle here in particular but most of the concepts are the same/or similar in other database systems.
Usually, you’re using B-tree indexes and unique constraints to police primary keys. And if you read the excellent book SQL Performance Explained by Markus Winand you might already know what pain you’ll be facing by using GUIDs. As long as your data volume is tiny and can fully live in the buffer cache you’re probably fine. To illustrate what happens once your dataset outgrows the buffer cache I setup a small test kit.

The data model is simple. I have two tables, TESTS and RESULTS. Each Test has zero or more Results. To store GUIDs I will use data type RAW(16). The rest of the columns will hold random data to fill the space.

create table tests (
    test_id raw(16) not null
  , vc2_long varchar2(4000 byte)
) tablespace myapp_data;

create unique index tests_idx_01 on tests (test_id) tablespace myapp_index;
alter table tests add constraint tests_pk primary key (test_id) using index tests_idx_01;


create table results (
    result_id raw(16) not null
  , test_id raw(16) not null
  , dt date
  , vc2_short varchar2(200 byte)
) tablespace myapp_data;

create unique index results_idx_01 on results(result_id) tablespace myapp_index;
alter table results add constraint results_pk primary key (result_id) using index results_idx_01;
create index results_idx_02 on results(test_id) tablespace myapp_index;
alter table results add constraint results_fk_01 foreign key (test_id) references tests(test_id) on delete cascade;

For ease of grep’ing SQL traces I separated tables and indexes to different Tablespaces. MYAPP_INDEX has one datafile with file# 20.

I wanted to use PL/SQL to keep the test case short and concise. Unfortunately, Oracle’s SYS_GUID function produces “sequential” GUIDs in my setup (Oracle 12.2 CDB on Oracle Linux 7.2). To have random GUIDs in PL/SQL I resorted to Java stored procedures (the implementation is not relevant to the case at hand):

create or replace and compile java source named "RandomGUID"
as
public class RandomGUID {
  public static String create() {
    return java.util.UUID.randomUUID().toString().replaceAll("-", "").toUpperCase();
  }
}
/

create or replace function random_java_guid
return varchar2
is
language java name 'RandomGUID.create() return java.lang.String';
/

create or replace function random_guid
return raw
is
begin
  return hextoraw(random_java_guid());
end random_guid;
/

Works like a charm 🙂

select random_guid() guids from dual connect by level <= 5;

GUIDS
--------------------------------
54746B0750374133BCF9FA85A6F2F532
C92168647BEC4A93982F19498238757E
3E4B858F41764126B177FCCB30CC73C5
4B7CD39D222D4E339482CD25F9AD6EA2
B8C5367F6B944EEA9BD71611CCB54E72

That’s it for the schema setup. To load data I use below code snippet (test1.sql) which in a loop inserts 1000 Tests. After each test it inserts 100 Results per Test in the inner loop and commits. The “RRT” package is used to collect session statistics (gv$session) and tracking wall clock time.

set verify off feedback off
set serveroutput on size unlimited

<<myapp>>
declare
  test_id tests.test_id%type;
begin
  rrt.stat_cfg_default;
  rrt.stat_start('&1');
  rrt.timer_start();

  for tid in 1 .. 1000 loop
    insert into tests t (test_id, vc2_long) values (random_guid(), dbms_random.string('A', trunc(dbms_random.value(200, 4000))))
    returning t.test_id into myapp.test_id;
    
    for rid in 1 .. 100 loop
      insert into results r (result_id, test_id, dt, vc2_short) values (random_guid(), myapp.test_id, sysdate, dbms_random.string('L', trunc(dbms_random.value(10, 200))));
    end loop;
    
    commit;
  end loop;

  dbms_output.put_line('Elapsed:' || to_char(rrt.timer_elapsed));
  rrt.stat_stop;
end;
/

To run the script concurrently in multiple sessions I use following shell script. It just spawns N SQL*Plus processes and runs the SQL script.

#!/usr/bin/bash

SCRIPT=$1
DEGREE=$2
EZCONN=$3

declare -i runid=$$
declare -i cnt=1

echo "Coordinator process pid ${runid}"
until [ $cnt -gt ${DEGREE} ]
do
  sqlplus -S -L ${EZCONN} @${SCRIPT} ${SCRIPT}.${runid}.${cnt}.log > ${SCRIPT}.${runid}.${cnt}.log &
  echo "Started sub-process ${cnt} with pid $!"
  cnt=$(( cnt + 1 ))
done

I ran the test case multiple times letting the database grow bigger with every run. I kept running until the performance got unbearable. On my VirtualBox VM setup it took 9 runs with 10 concurrent processes for the performance to go way down south. I deliberately configured a small SGA of 800 MB which resulted in about 500 MB buffer cache to hit the issue soon. Obviously, your milage may vary as the larger the buffer cache the longer you can sustain.
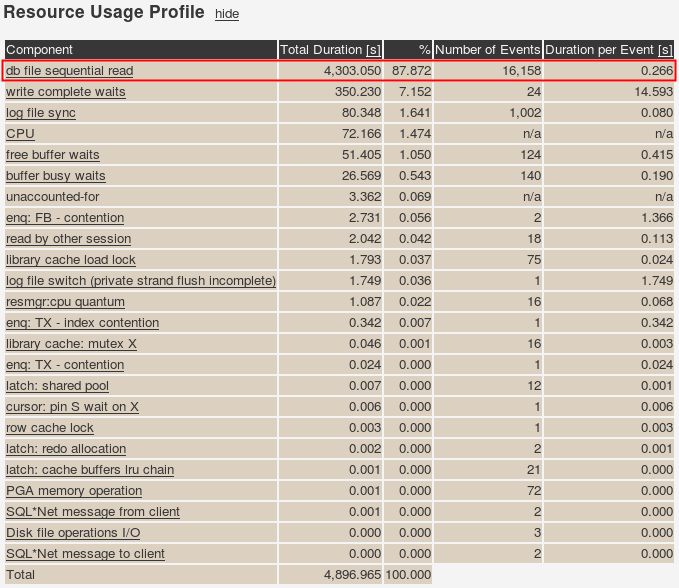
Let’s look at resource usage profile of one of the sessions from run 9. I processed the raw extended SQL trace file using Chris Antognini’s TVD$XTAT.

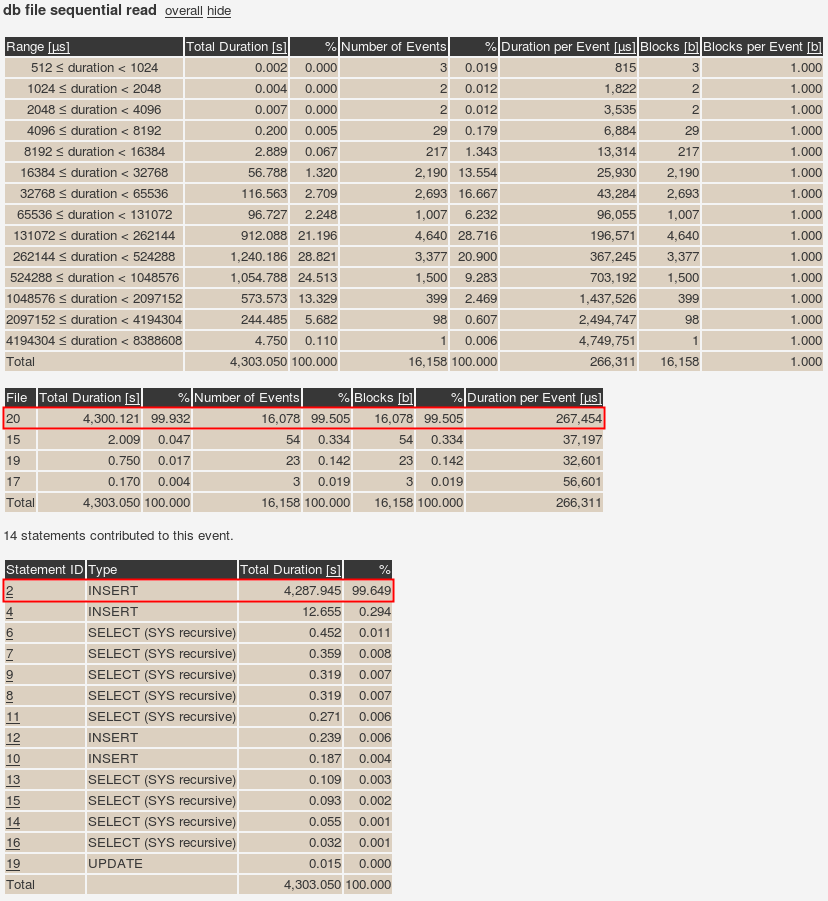
Wow, this single session did 16,158 random physical reads (db file sequential read). Let’s see which statements contributed to those reads:

Almost all of the random reads (16,078) came from the INSERT statement with ID 2 which is:

All this physical read I/O to INSERT records, which is all this test case does. And as you can see above the I/O is done on file 20 from the MYAPP_INDEX Tablespace. What’s the distribution between objects?

$ grep 'db file.*file#=20' *ora_5592.trc | cut -d ' ' -f12 | sort | uniq -c
     42 obj#=61805
  14538 obj#=61807
   1498 obj#=61808
select object_id, object_name from cdb_objects where con_id = 4 and owner = 'MYAPP' and object_id in (61805, 61807, 61808) order by object_id;

 OBJECT_ID OBJECT_NAME
---------- ---------------
     61805 TESTS_IDX_01
     61807 RESULTS_IDX_01
     61808 RESULTS_IDX_02

Considering the data pattern it makes sense that RESULTS_IDX_01 is suffering the most. It is the unique index that gets the most index entries added. Index RESULTS_IDX_02 benefits from the repeating foreign key values per outer-loop that all go into the same leaf blocks which Oracle most likely caches.

select table_name, index_name, uniqueness, blevel, leaf_blocks, distinct_keys, avg_leaf_blocks_per_key, avg_data_blocks_per_key, clustering_factor, num_rows from dba_indexes where index_name in ('TESTS_IDX_01', 'RESULTS_IDX_01', 'RESULTS_IDX_02') order by table_name desc, index_name;

TABLE_NAME  INDEX_NAME      UNIQUENESS  BLEVEL  LEAF_BLOCKS  DISTINCT_KEYS  AVG_LEAF_BLOCKS_PER_KEY  AVG_DATA_BLOCKS_PER_KEY  CLUSTERING_FACTOR  NUM_ROWS
----------- --------------- ----------- ------- ------------ -------------- ------------------------ ------------------------ ------------------ --------
TESTS       TESTS_IDX_01    UNIQUE      1       467          90000          1                        1                        89999              90000
RESULTS     RESULTS_IDX_01  UNIQUE      2       44237        8941107        1                        1                        8941107            8941107
RESULTS     RESULTS_IDX_02  NONUNIQUE   2       50757        92216          1                        4                        424304             9137794

Up to test run 8 Oracle could keep the most relevant parts of the indexes in the buffer cache. After that Oracle had to constantly “swap” index leaf blocks in and out of the buffer cache.

select segment_name, tablespace_name, blocks, extents, bytes/1024/1024 mb from dba_segments where (segment_name like 'TESTS%' or segment_name like 'RESULTS%') order by segment_name desc;

SEGMENT_NAME    TABLESPACE_NAME  BLOCKS  EXTENTS  MB
--------------- ---------------- ------- -------- ----
TESTS_IDX_01    MYAPP_INDEX      512     4        4
TESTS           MYAPP_DATA       31360   245      245
RESULTS_IDX_02  MYAPP_INDEX      50560   395      395
RESULTS_IDX_01  MYAPP_INDEX      44928   351      351
RESULTS         MYAPP_DATA       191744  1498     1498

I also graphed the session statistics aggregated (average of the 10 concurrent sessions) by test runs. It clearly shows a correlation between physical reads and elapsed time. Who’d a thunk it? 🙂

Due to the random character of GUIDs every new index entry potentially goes into any of the index leaf blocks. Thus, performance is good as long as you can cache the entire index, meaning every index supporting primary and foreign keys in you entire application. That’s probably too much to ask.
Now, you might know about sequential GUIDs that Oracle and SQL Server implement and start using them. This might alleviate the problem somewhat, but could result in the next performance issue: right hand side index leaf block contention!

As this post is getting long already I will talk about a solution that scales in my next installment.

Killing QOPATCH zombies

I recently had various cases where functions/procedures of DBMS_QOPATCH raised “ORA-20001: Latest xml inventory is not loaded into table” on Windows:

  • Platform: Windows Server 2012 R2
  • Oracle Version: 12.1.0.2.11

The issue can best be seen from SQL*Plus:

SQL> select dbms_qopatch.get_opatch_install_info from dual;
ERROR:
ORA-20001: Latest xml inventory is not loaded into table
ORA-06512: in "SYS.DBMS_QOPATCH", line 1937
ORA-06512: in "SYS.DBMS_QOPATCH", line 133

Another symptom of the issue can be found during instance startup when there is no patch information dumped to the alert.log, even though you know there are patches installed.
Extract from alert.log:

===========================================================
Dumping current patch information
===========================================================
No patches have been applied
===========================================================

Trust me, this database has patches installed 🙂
So, what’s going on…

DBMS_QOPATCH writes a log in %ORACLE_HOME%\QOpatch\qopatch_log.log. Here’s what it says:

 LOG file opened at 05/02/16 21:54:17

KUP-05004:   Warning: Intra source concurrency disabled because parallel select was not requested.

KUP-05007:   Warning: Intra source concurrency disabled because the preprocessor option is being used.

Field Definitions for table OPATCH_XML_INV
  Record format DELIMITED BY NEWLINE
  Data in file has same endianness as the platform
  Reject rows with all null fields

  Fields in Data Source: 

	XML_INVENTORY                   CHAR (100000000)
	  Terminated by "UIJSVTBOEIZBEFFQBL"
	  Trim whitespace same as SQL Loader
KUP-04004: error while reading file C:\app\oracle\product\ora1210211\QOpatch\qopiprep.bat
KUP-04017: OS message: The operation completed successfully.
KUP-04017: OS message: Argument(s) Error... Cannot use file "C:\app\oracle\product\ora1210211\QOpatch\xml_file.xml" to generate XML output.
Specify path/filename and make sure filena
KUP-04118: operation "read_pipe", location "skudmir"

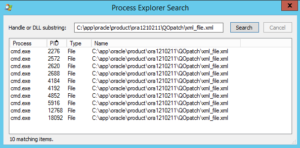
Alright, DBMS_QOPATCH calls “qopiprep.bat” as a pre-processor which in turn tries to write (and at the very end delete) a file named “xml_file.xml”. So, this file is used temporarily and should not exist when there’s currently no call to DBMS_QOPATCH running. When I checked the file was there and Process Explorer revealed that there were multiple “cmd.exe” processes having an open file handle, thus locking the file from deletion.

ps-file-handes

Most of these “cmd.exe” processes were spawned by “oracle.exe” and were not doing any work anymore. I went and killed all of them, one after another. Just be careful and make sure these processes are actually “zombies”. After killing these “cmd.exe” processes there were no locks on “xml_file.xml” anymore and DBMS_QOPATCH worked again as expected.

SQL> select dbms_qopatch.get_opatch_install_info from dual;

GET_OPATCH_INSTALL_INFO
--------------------------------------------------------------------------------
<oracleHome><UId>OracleHome-6f58d48c-880c-45ab-88b4-5831abc60f31</UId><targetTyp

Unfortunately, I haven’t been able to reproduce the issue at will. For the moment I’m fine having a solution.

Remember, datapatch/sqlpatch uses the same funcionality of DBMS_QOPATCH…so applying a patch could fail as well.

RMAN in FIRST_ROWS hell

A short while back I was doing a database upgrade/migration from 11.2.0.1 to 12.1.0.2 to a new server. To keep the downtime of the 850GB big database short I used Transportable Tablespaces together with incrementally updated backups where the datafile copies are placed on the target machine’s storage using a shared mount. So, during the downtime (as soon as the Tablespaces are set READ ONLY) all there’s left is doing the last inc 1 backup and the meta data export / import. Everything went fine on all test databases which were freshly cloned from production.
But then, around comes time for production. I started taking the inc 0 datafile copy backups a few days before. Eight long hours later I was ready to take inc 1 backups from time to time and apply them on the datafile copies. This is where all the good plans went south. Every time the “BACKUP INCREMENTAL LEVEL 1 FOR RECOVER OF COPY WITH TAG…” command ran it took about 23 seconds before RMAN actually started taking the backup. During the production downtime this is probably fine if there’s only 5 datafiles. Our database had more than 50 datafiles. And, you have to account for 50 x 23 seconds for the “RECOVER COPY OF DATAFILE…” command as well as the same problem applies there, too. Clearly, this issue needed resolving before the production downtime.

My investigation showed that above RMAN commands trigger the calling of DBMS_RCVMAN.getRcvRec which in turn calls DBMS_RCVMAN.getDataFileCopy. In there are some complex queries involving V$BACKUPSET, V$DATAFILE_COPY, etc. and one of these queries did have a very bad execution plan. First I thought there might be a problem with the object statistics on the underlying X$ tables, namely X$KCCBF, X$KCCBP and X$KCCBC. OK, the stats were somewhat stale so I gathered them for the involved X$ tables. Unfortunately, this didn’t solve the problem of the bad execution plan. Then, I remembered that during the initial analysis of the database I noticed that OPTIMIZER_MODE was set to FIRST_ROWS on the instance level (for whatever reason the SW vendor claimed this was best). Of course, this setting also affected RMAN. As the database was still fully productive I couldn’t just change the parameter to ALL_ROWS. Setting up a login trigger for RMAN seemed too intrusive. The solution was simple: run an ALTER SESSION at the start of the RMAN session and all is fine…

sql "alter session set optimizer_mode = ALL_ROWS";

Btw., on the new 12.1.0.2 database the application runs just perfectly with ALL_ROWS 😉